The Use Of Proteomic And Bioinformatics Techniques For The Detection Of Protein Biomarkers Following Growth Hormone Administration
J Boateng, L Lancashire, P Brown, M Ahmad, B Ball, R Davy, S Yu Yang, J Roberts, P Teale, C Velloso, R Rees, G Ball, G Goldspink, C Creaser
Keywords
artificial neural network, growth hormone administration, high throughput screening, maldims, serum protein biomarkers
Citation
J Boateng, L Lancashire, P Brown, M Ahmad, B Ball, R Davy, S Yu Yang, J Roberts, P Teale, C Velloso, R Rees, G Ball, G Goldspink, C Creaser. The Use Of Proteomic And Bioinformatics Techniques For The Detection Of Protein Biomarkers Following Growth Hormone Administration. The Internet Journal of Genomics and Proteomics. 2006 Volume 2 Number 2.
Abstract
A combined mass spectrometry and bioinformatics screening technique has been developed for detecting the administration of exogenous growth hormone (GH), through changes in the serum proteome. Serum samples from porcine GH (n=14) and placebo (n=13) treated mice were analysed by MALDI-TOF-MS. Mass spectrometric data were processed using artificial neural networks to identify protein biomarkers capable of differentiating between control and GH treated subjects. Four ions m/z 17201 (± 34), 18978 (± 38), 19860 (± 40) and 20190 (± 40) were identified, which correctly predicted 93 % of a separate subset of blind samples. The sensitivity and specificity of the model was respectively 86 % and 100 % (12/14 GH treated and 13/13 controls correctly assigned respectively). Reproducibility of the four ion model was assessed using an intra-laboratory replicate data set of separately prepared serum samples. Our results show the potential of MALDI-MS for detecting GH administration with good sensitivity and specificity through indicative biomarker patterns determined using computational bioinformatics techniques.
Introduction
Growth hormone (GH) is synthesised and secreted by the somatotroph cells of the anterior pituitary and, together with insulin-like growth factor (IGF-1), regulates body growth, protein, carbohydrate and lipid metabolism [1,2]. it is used clinically to treat gh-deficient patients, with an increase in lean body mass and a decrease of fat mass [3,4]. it is also the subject of current research for use as an anti aging agent, [5] although this has yet to be clinically confirmed [6,7,8].
The abuse of exogenous GH in sports has attracted attention due the perception that its misuse cannot be detected by current analytical techniques. Detection of GH abuse is complicated because of difficulty in distinguishing between the endogenous and the recombinant forms [9]. endogenous gh also has a short half life and a pulsatile release pattern [10], and is dependent on factors such as nutritional intake and exercise. the levels of gh can increase up to seventy fold in response to acute exercise [11,12]. as a result, random measurements of elevated plasma levels of gh are not indicative of exogenous administration and any excess detected beyond spontaneous episodic increases, must exclude the presence of disease such as acromegaly. repeated testing over 24 hours after a period of known abstinence may overcome the pulsatile release problem, [13] but is limited by the close similarity of recombinant human growth hormone (rhgh) to the endogenously produced gh. clearly, any methodology aimed at detecting abuse cannot rely simply upon the detection of gh and alternative strategies have been developed. the two most significant approaches to detect exogenous gh are based on measurements of the different gh isoforms [14] and gh-dependent proteins (biomarkers). both methods utilise immunologic assays, for confirmatory analysis. for immunological tests, two separate assays, which detect different antibody binding sites of the target proteins, are required by the world anti doping agency (wada) to confirm the biomarker [15].
The isoform base immunological method depends upon the fact that rhGH contains only the 22-kDa isoform while endogenous GH exists in several forms. The 22-kDa isoform is the most abundant (75%), the rest, including the 20- and 17-kDa isoforms, collectively termed “non-22-kDa”. A high ratio of 22- to non-22-kDa GH is used as an indication of exogenous GH abuse [16]. this approach is limited by the increase in the 22-kda isoform caused by exercise and short half-lives of gh isoforms, leading to a limited detection period [17,18]. the second technique is based on the downstream effects from the anabolic action of gh, which leads to the secretion of several proteins. the circulating concentration of these proteins can be used as a means of detecting exogenous gh administration [19,20]. measurement of multiple markers can detect gh abuse with enhanced sensitivity and specificity compared with single-marker analysis. two groups of potential markers have been identified [21,22,23], with igf-1 and procollagen iii terminal peptide (p-iii-p), being the two most important candidates. while this approach has proved highly effective, issues such as standardization of calibrants / standards and the use of well defined procedures, to ensure dissociation from and removal of igf binding proteins, need to be addressed. it is also dependent upon the availability of stable and reliable immunoassays, as alterations in assay performance result in the need to re-establish the reference interval [15,24].
Improved screening procedures, capable of high throughput analysis are therefore required for the detection of biomarkers of GH administration with more sensitivity and specificity than current methods. In this paper, we report an innovative mass spectrometry-based proteomics approach for screening for GH administration. In recent years, there has been increasing interest in the application of MALDI mass spectrometry [25] for identifying biomarkers of disease [26], individual response to treatment [27], and disease progression, through changes in the proteome [28]. protein biomarkers of human gh action have been reported, using serum proteomic profiling by maldi with protein chip mass spectrometry [29]. two dimensional gel electrophoresis and maldi-tof have also been used for characterizing gh isoforms, in order to understand their mechanisms and functions in gh related diseases [30].
The use of MALDI in proteomics analysis usually generates large, complex data sets and bioinformatics approaches, such as artificial neural networks are needed to identify characteristic biomarker patterns from such data [31]. artificial neural networks (anns) are a powerful statistical data mining tool utilised for the prediction of biologically important molecules in complex systems [32]. they are analogous to human neurons in the way in which they learn patterns associated with particular characteristics through a process of iterative learning. input connections associated with reducing the overall error for predicting unknown samples are reinforced by strengthening the weighted link of the particular neuron. the advantages of anns include the ability to model non-linear data, enabling them to process complex data interactions that are difficult to explain by linear approaches. they are capable of generalisation that allows them to interpret information that is different from training data, resulting in the ability to predict for new cases and also able tolerate noise and data containing missing values [33].
The objective of this study was the development of a method using MALDI-TOF mass spectrometry and ANNs, for the detection of serum protein biomarkers capable of differentiating between controls and subjects exposed to exogenous GH. The identification of downstream biomarker signature patterns in the serum proteome, that are indicative of GH administration, make it possible to develop a high throughput screening procedure based on this approach.
Materials and methods
Materials
Sinapinic acid (SA) matrix and protein calibration mix (Cytochrome C -
Sample collection and treatment
All procedures were performed in accordance with institutional guidelines for the care and use of laboratory animals and approved by the Home Office in the UK (ppl70/6097). A subcutaneously implanted osmotic pump was used to systemically deliver 0.19 U/kg/day of porcine GH (Sigma, Germany) into 14 adult male mice (strain C57/B6) for 3 weeks. Osmotic pumps containing PBS only were also implanted into a separate control group (n=13) over the same time period [34]. animal body weight was monitored throughout the experiment. blood samples were taken from each mouse 3 weeks post-administration under terminal anaesthetic (25% urethane) via the heart puncture technique. blood was left to stand at 25 °c for 30 minutes, centrifuged at 1000x
Mass spectrometry sample preparation
Serum samples were prepared by a 1 in 10 dilution of freshly thawed serum in autoclaved, clear plastic eppendorf tubes (0.5 mL) with 0.1 % TFA (Fisher Scientific, UK) and vortexing. The diluted sample was spotted on a MALDI target plate using sinapinic acid (SA) (LaserBioLabs, Cedex, France) as matrix. The SA matrix solution was freshly prepared as a 10 mg / mL suspension in 50 % ACN / 0.1 % TFA in a black plastic eppendorf tube and vortex mixed. The dried-droplet method was used for deposition by pipetting 1 µL of matrix onto the target plate, followed by 1 µL of sample and then the sample/matrix mixture was mixed on the plate. All the samples and blanks (TFA/matrix) were deposited on the plate in duplicate according to a randomised plate map, which was prepared before sample deposition.
Analysis of serum protein biomarkers
MALDI-TOF mass spectra were acquired using a Shimadzu Biotech AXIMA-CFR+ instrument (Shimadzu, Manchester, UK) operated in positive linear mode. Serum from GH treated (14 samples) and placebo treated control (13 samples) mice were spotted in duplicate together with matrix (10 mg / mL SA) by the dried-droplet method and analysed by MALDI-TOF for protein biomarkers using close external calibration. Spectra for all serum samples were acquired automatically using the raster mode function of the spectrometer where a fixed number of laser shots were fired across the whole sample spot. A protein calibration mixture consisting of cytochrome C (
The MALDI-TOF analysis was repeated by a different operator three months after the first analysis of all samples to assess intra-laboratory reproducibility. Fresh aliquots of serum samples were diluted separately, and spotted onto the target plate as above and analysed by MALDI-TOF-MS. The resulting data was used to validate the ANNs model developed for the first set of experiments. An aliquot of the porcine GH administered to the mice was analysed separately by MALDI-TOF using the procedure described for the serum samples.
ANNs Analysis
Results and Discussion
Weight changes in mice over course of treatment
As a measure of GH administration efficacy, the weights of the mice used were monitored after the administration of PBS and GH to the control and treated groups respectively. The weights of both groups increased initially and converged at the end of the administration (week 3), although the increase in weight of the GH treated animals, was greater in weeks one and two than in the control animals (Figure 1).
Figure 1

Figure 2

The effects of short term administration of GH, has been reported by Berggren et al [35] who found an increase in body weight after gh treatment, which was explained by an increase in extracellular water content. the increase in body weight of the mice in weeks one and two may therefore be due, in part, to extracellular water changes. however, these changes can disappear at the end of the experiment (week 3) because extracellular water, unlike intracellular water, can be lost more easily, causing the weights to converge.
MALDI-TOF analysis of serum
The optimal sample preparation procedure for serum analysis by MALDI-TOF was determined in the early part of this study. This involved two main stages of investigation, firstly, the sample processing, required before deposition onto the MALDI target plate and, secondly, the method used for the deposition of the sample and matrix. A variety of different clean-up procedures were investigated for the removal of salts and other interfering substances in serum. These included ZipTipTM clean-up and dilution of the serum, to reduce the concentration of the contaminants. The ZipTipTM clean-up process was effective, but led to excessive loss of some protein constituents which were not eluted from the tip. As a result, a 1:10 dilution of serum with 0.1 % TFA was the method of choice for all subsequent experiments to detect proteins by MALDI/MS.
Shot to shot variability in MALDI can lead to differences in intensity due to many factors such as variations in laser power, matrix crystallisation during drying of the spot [36] and the method of spotting. the dried droplet method was found to give the best spectral intensity and reproducibility. in order to avoid any systematic bias in the analysis, samples and blanks were spotted in duplicate and in randomised order on the plate. in addition, spectra were acquired automatically and acquisition parameters such as number of laser shots and laser power were kept constant for all serum and blank sample spots. random heterogeneity does not affect the ability of anns to generalise whilst modelling across the whole mass spectrum during bioinformatics analysis.
Representative MALDI mass spectra from serum protein profiling of GH treated and control mice are shown in Figure 2.
Figure 3

Figure 4

Mass spectrometry peaks which discriminated between treated and control samples were not clearly evident by a visual inspection of the mass spectrometry spectra between
Figure 5

ANNs analysis of MALDI protein data
The basis of the ANNs analysis within this study was a back propagation algorithm applied to a multi-layer perceptron architecture, which was constrained by two hidden nodes. The raw
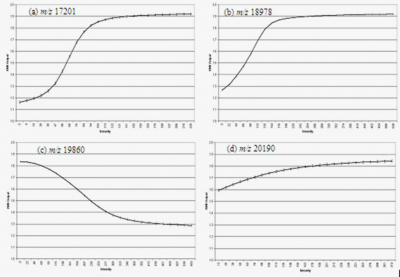
A sequence of ordinal variables was identified to explain the predictive variation in the population. The first step identified the primary order variables and their predictive performance. Subsequent variables identified further combinatorial explanations of the variation in the population in combination with the first variable. The stepwise additive approach identified the optimum subset of variables which were capable of correctly predicting whether a sample was control or treated. For each model, a subset of models was trained using a stepwise additive approach. A set of single input models was developed using the first marker from the MALDI/MS proteomic profile. This single marker set consisted of 50 sub-models trained for 50 different randomly extracted cross validation data sets. The MSE and percentage of validation samples correctly classified were determined for these data along with standard errors and confidence intervals. This modeling process was repeated for each of the markers in the profile in effect creating 2066 single marker model sets (103,300 models) at each step. This process resulted in the screening of 413,200 models to determine an optimal subset of markers. The stepwise additive approach for protein profiling identified four ions, which together predicted 93 % of a separate subset of validation (blind) samples correctly. The masses (
Two of the biomarker ions have
The sensitivity of the ANNs model (the percentage of GH treated samples correctly classified) was 86 % (12/14 of the GH treated samples correctly assigned), whilst the specificity (the percentage of control samples that were correctly classified) was 100 % (13/13 of the control samples correctly assigned). Average predicted values from the set of cross validated models were ranked and plotted (Figure 4). This shows the sample population structure and indicated individuals that were close representatives of controls (ANNs prediction < 1.5) or GH treated samples (ANNs prediction > 1.5). An outlier (sample GH 1) was consistently incorrectly classified. This mouse showed a low weight gain in week 1 that was close to that of the control group than the treated group. It may be that this was due to a poor response to GH for this animal or failure of the osmotic pump used to deliver GH. Either reason could explain the apparent mis- assignment by ANNs. Model performance was further evaluated by receiver operator characteristic (ROC) curve analysis, and an area under the curve (AUC) value of 0.962 was obtained. An AUC of 1 indicates a model having equal sensitivity and specificity, with perfect classification.
Figure 6

Figure 7
(a) GH treated
(b) Placebo treated controls
(a)
The results from this analysis showed three of the four biomarker ions having strong discriminatory responses. These response curves made it possible to characterize the ions by determining whether they showed an increase or decrease in intensity with regards to growth hormone administration. Two ions,
A separate MALDI/MS dataset was obtained by a different operator at a different time using a fresh aliquot of serum samples, as part of an assessment of the batch-to-batch intra-laboratory reproducibility of the method. The four-ion model from the initial ANNs analysis was then applied to this dataset. This resulted in 9/13 control, and 10/14 of the GH treated samples assigned to the correct class. The purpose of the validation experiment for the ANN model and the mass spectrometry analysis was to evaluate the robustness of the entire proteomic and bioinformatic protocol from sample storage and handling, sample preparation, mass spectrometric analysis through to the data processing and ANN analysis. To help improve batch-to-batch predictability for diagnostic modelling, sample handling and preparation protocols have been standardised. The development of automated sample dilution, mixing and spotting onto MALDI target plate would be expected to reduce variability in sample preparation and to further improve method reproducibility.
Concluding remarks
Our results show that MALDI mass spectrometry in combination with ANNs has potential as a rapid screening tool for predicting GH administration, with good sensitivity and specificity. The approach overcomes problems with existing procedures. The ability to predict GH administration is evident, and future studies involving a larger sample set would be expected to improve the reproducibility of the predictive performance of the model once potential sources of variability have been eliminated or reduced.
Acknowledgements
The authors would like to thank the World Anti Doping Agency (WADA) for funding this research and the Horse Racing Betting Levy Board (HBLB) for supplementary funding.